Call Statistics
Weekly Call Summaries
Week of April 13, 2025Week of April 6, 2025Week of March 30, 2025Week of March 23, 2025Week of March 16, 2025
Community Demographics (Interactive Dashboard provided by CRAIG Community Risk Assessment)
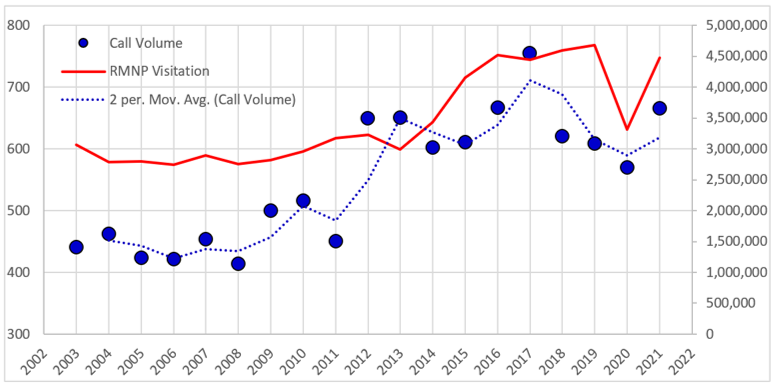
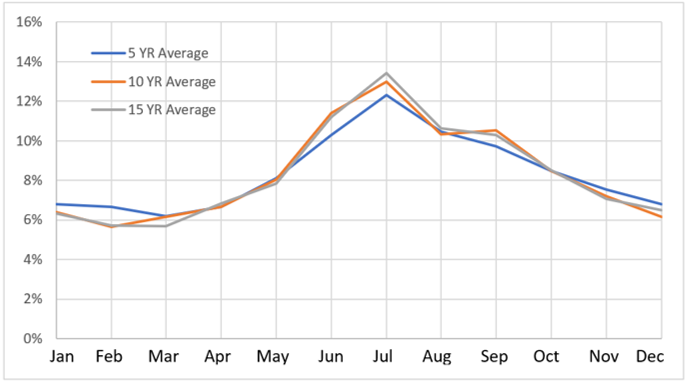
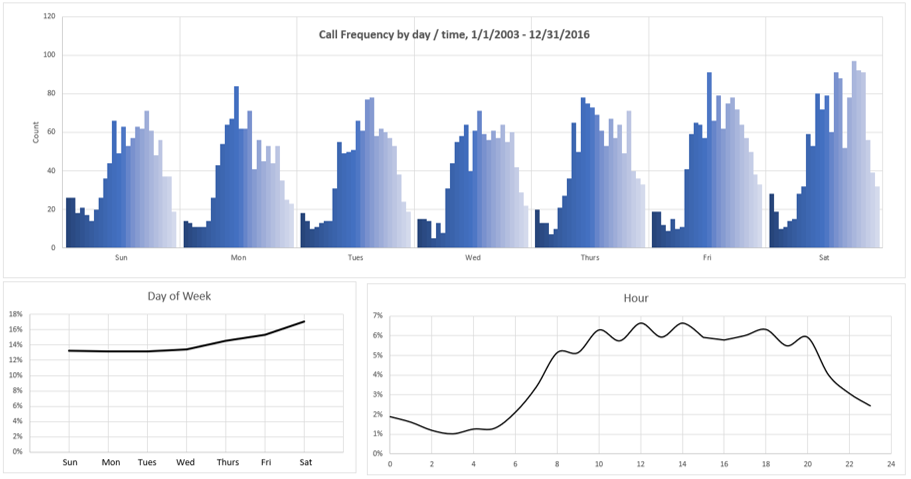
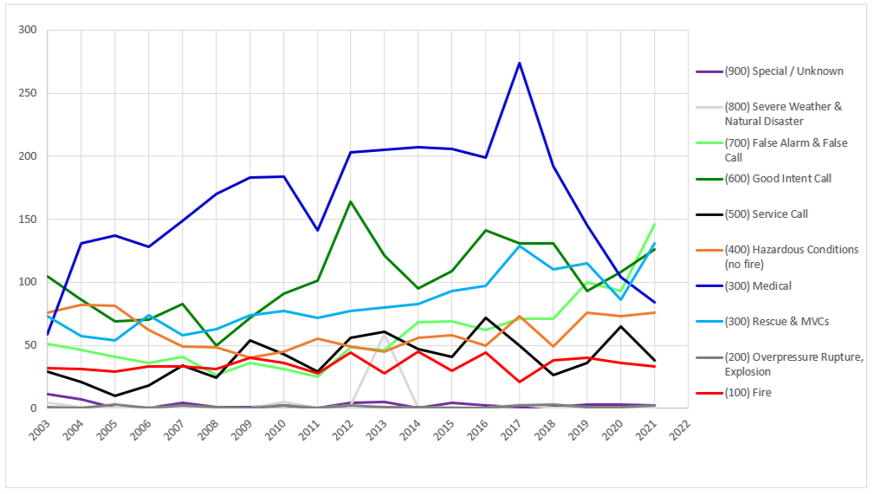
Previous Years Statistics (data presented for informational purposes only)
Charts last updated January 2022
See data through December 2022 in our annual reports: https://www.estesvalleyfire.org/annual-reports


